 FAKE RONJAN!!
NBA Conference Finals: game by game series stats
Well, we've got two of our NBA "Final Four" all set, with Miami and Memphis dispatching their respective battered opponents in five games. With Indiana and Golden State (emo hedge alert!) likely to join them in the next few days, what better time than now to look back at the past 28 years of Conference Finals and find something ... anything ... worth talking about!
Why 28 years? I was originally curious in comparing the Conference Finals to the NBA Finals because they have different home-field advantage formats. The Conference Finals -- like every round before them -- have the higher seed playing at home in games in 1, 2, 5, and 7 (2-2-1-1-1). Meanwhile, ever since 1985, the NBA Finals switches it so the higher seed plays at home in games 1, 2, 6, and 7 (2-3-2). (Before 1985, the NBA Finals were also on the 2-2-1-1-1 schedule.)
Long story short, to look at this I put together a spreadsheet covering the past 28 years where I have every NBA Finals and Conference Finals series with game-by-game results. (I focused only on Conference Finals to reduce the impact of "better team" syndrome which affects series dynamics more in earlier rounds.) More on the 2-2-1-1-1 vs. 2-3-2 format later, because the Conference Finals stuff actually holds up well enough on its own!
So to kick things off, here's a diagram showing how the Conference Finals have historically progressed:
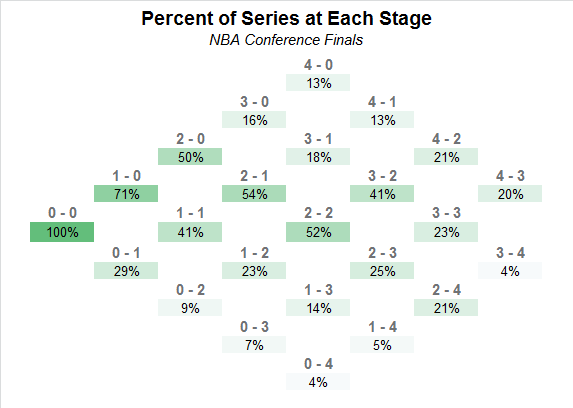
How to read: Start on the left side. 100% of Conference Finals start tied 0-0. 71% of them have the higher seed up 1-0, while 29% of them have the lower seed win the first game so the higher seed trails 0-1. After two games, half of Conference Finals have the higher seed up 2-0, 41% have the series tied, and 9% have the higher seed trailing 0-2. And so on.
Already kind of an interesting start. If we just follow left to right and trace the "most common" outcome at each stage, we end up with a 7 game series with the home team winning all 7 games. I also found it interesting that a 6-game series is equally likely to be won by the higher seed or the lower seed.
But let's build on this. Now, let's take the same visual and look at the higher seed's chance of winning the series with a given series score:
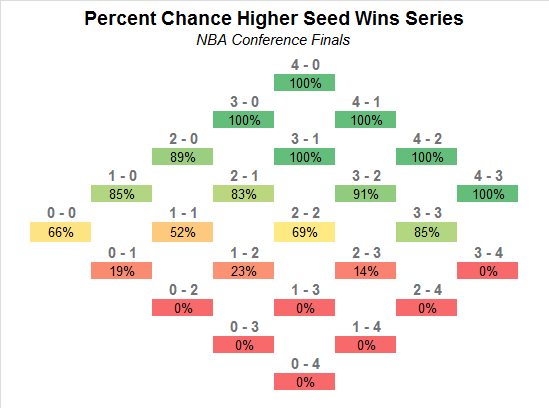
How to read: Start on the left side. 66% of series that are 0-0 have the higher seed go on to win. After one game, if the higher seed is up 1-0 they have an 85% chance to win the series, and if they are down 0-1 they have just a 19% chance to win the series. And so on.
A few things worth pointing out at this stage:
- In the Conference Finals, a 2-game deficit is virtually insurmountable. Only three teams have ever come back from being down 2 games at any point (1993 Bulls over Knicks, 2007 Cavs over Pistons, 2012 Thunder over Spurs) and they were all the lower seed who lost the first two games on the road and then won four straight.
- They say Game 1 is the tone-setter, and they're not kidding. Whoever wins has better than an 80% chance of carrying the series. In fact, a 1-0 lead is slightly more valuable than a 2-1 lead, which is a bit counter-intuitive.
- Game 5 after a 2-2 series tie is, predictably, the swingiest non-elimination game there is.
- Game 7 goes in favor of the higher seed 85% of the team, which is surprisingly high -- the higher seed wins roughly 70% of the time in games 1, 2, and 5. By these historical measures, being tied 3-3 as the higher seed is equivalent to having a 1-0 series lead and better than having a 2-1 series lead!
One last diagram with the same format, this time detailing the ultimate number of games a series goes:
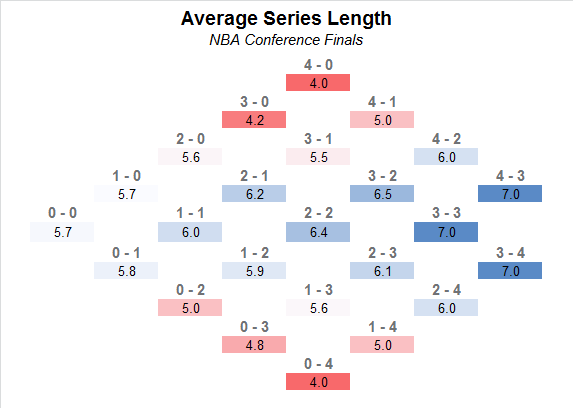
How to read: Start on the left side. A series that is tied 0-0 will last an average of 5.7 games. A series where the higher seed is up 2-1 will last an average of 6.2 games. A series where the higher seed is down 1-3 will last an average of 5.6 games. And so on.
I don't have much to say about this one, but since it was easy to compile, might as well throw it in there.
Stay tuned for a comparison of the 2-2-1-1-1 series format vs. the 2-3-2 series format, where we look at these same dynamics in the NBA Finals!
-rj