 FAKE RONJAN!!
Playing to the level of the competition
"Eli Manning is a real piece of work."
That's the first thing I said to my buddies Connor and Rob -- huge New York Giants fans -- after the Giants destroyed the powerful Green Bay Packers, 38-10, to move to 7-4 on the season.
It always seems to be the same story with the Giants in the Eli Manning era. Not only do they seem to play down to the level of their competition, but it almost works in the other direction. As in, not only do the Giants play equally well against good teams as in bad, but they seem more likely to actually beat good teams than to beat bad teams!
2012 was a perfect example through the first 11 games. The Giants handily defeated the eventual NFC champion San Francisco 49ers and the eventual NFC North champion Packers, and they eeked out a close victory against the eventual NFC East champion Redskins.
Meanwhile, three of their four losses (at the time) came against teams that would not make the playoffs, and they nearly lost to Tampa Bay as well in a game that they trailed by 14 in the 3rd quarter.
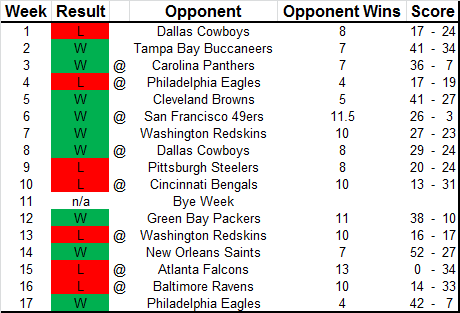
Chris (one of our site's authors, and also a huge Giants fan) and I decided to investigate -- was this actually true? Did the math prove it out?
We came up with an approach to test this theory that involved using the Simple Rating System (SRS), an easily replicable, retrodictive rating formula that produces numerical "team strength" levels by looking at margin of victory and adjusting for schedule strength. (I plan to run my own retrodictive NFL power rankings a few weeks into the season, so more on the rating formula later!)
Once you have each team's SRS score, it's easy to proceed. If two teams are playing each other, subtract their SRS scores from each other, add ~2 points for home field advantage, and voila -- that's your predicted victory margin! No fuss, no muss.
From here, you can predict the victory margin for every game that has already happened and compare this to the actual victory margin that took place. And from there, you can focus on each of the 32 NFL teams and see how closely their predictions matched up with the actual results.
So Chris actually ran the analysis and his buddy, David Kalan, published the results. The results were incredible. Indeed -- the New York Giants actually had a better chance to win against good teams than they did against bad teams, and they were the only team in the NFL with this trend!
Of course, then enters the Chris jinx. I have started to wonder if there is a quantum physics-like issue where Chris changes outcomes when he starts observing them. We've already seen it here with his 2013 Florida Marlins observation and eventual apology.
Kalan closed his post with an entirely-defensible-if-not-for-the-Chris-jinx line, "New York's home stretch will be tough as it hones in on a second consecutive NFC East title. And that just might be a good thing."
And that was it for the Giants. They lost three of their next four contests with all of the losses coming against playoff teams, and they missed the playoffs.
I decided to go back, slightly tweak the methodology (without adjusting the fundamental approach), and look at the final 2012 season results just for fun.
The five teams most likely to play well against good teams and poorly against bad teams (like the Giants through the first 11 games):
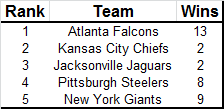
Even after their chalk finish, the Giants are one of the top five teams who perform down to the level of their competition.
The five teams most likely to play well against bad teams and poorly against good teams (as in, what you'd actually expect):
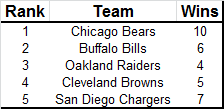
We'll follow-up on this with more seasons and additional details in the future. I hope you enjoyed this first crack at it!
-rj